Boomi DataDetective
Boomi DataDetective lets you visualize the movement of Personal Identifiable Information (PII) between integration connections. A summary details the data fields, connectors, processes, and countries involved. You can view PII details using the map visualization or table view.
Boomi DataDetective data is refreshed weekly from your Integration account. It classifies data as PII by looking at field names and process step names. It does not use your processed data. Like our other AI Products, Boomi DataDetective solely uses the customer-agnostic de-identified metadata as outlined in the Data Collection. It utilizes Boomi internal SLMs to determine and classify the sensitivity of your data, including PII.
Prerequisites
To use DataDetective, you must have the following:
- The piiDataInsights feature is enabled on your account. Contact your Boomi Administrator to enable this privilege.
- Integration Build Read access or Integration Build Read Write access.
- Data Detective Read access or Data Detective Read Write access. Read User roles and privileges to learn more about default Boomi Enterprise Platform roles and permissions.
Important considerations
- DataDetective is not supported in the EU Platform.
- DataDetective currently supports the English language.
- DataDetective supports FlatFile, XML, JSON, and DB formats.
- DataDectective displays information for up to 1000 data fields.
- You can see data in DataDetective only if you opt in to Boomi Data Collection.
- You can access the DataDetective agent from the main platform page.
- The DataDetective Agent is included as part of the Boomi AI Starter Pack and is available with the following Boomi Enterprise Platform editions:
- Personal Edition (30-day free trial)
- Base Edition
- Professional Edition
- Professional Plus Edition
- Enterprise Edition
- Enterprise Plus Edition
Benefits
Viewing PII metadata statistics helps you:
- Make informed decisions about data and PII
- Gain insight into how sensitive data is integrated between sources
- Develop efficient processes for handling PII
Use cases
With Boomi DataDetective you can:
- Explore PII data movement across countries using a global visualization
- Analyze PII data statistics by integration, data object, PII category, and more
- Manage PII data fields by suggesting the tracking of data field categorization
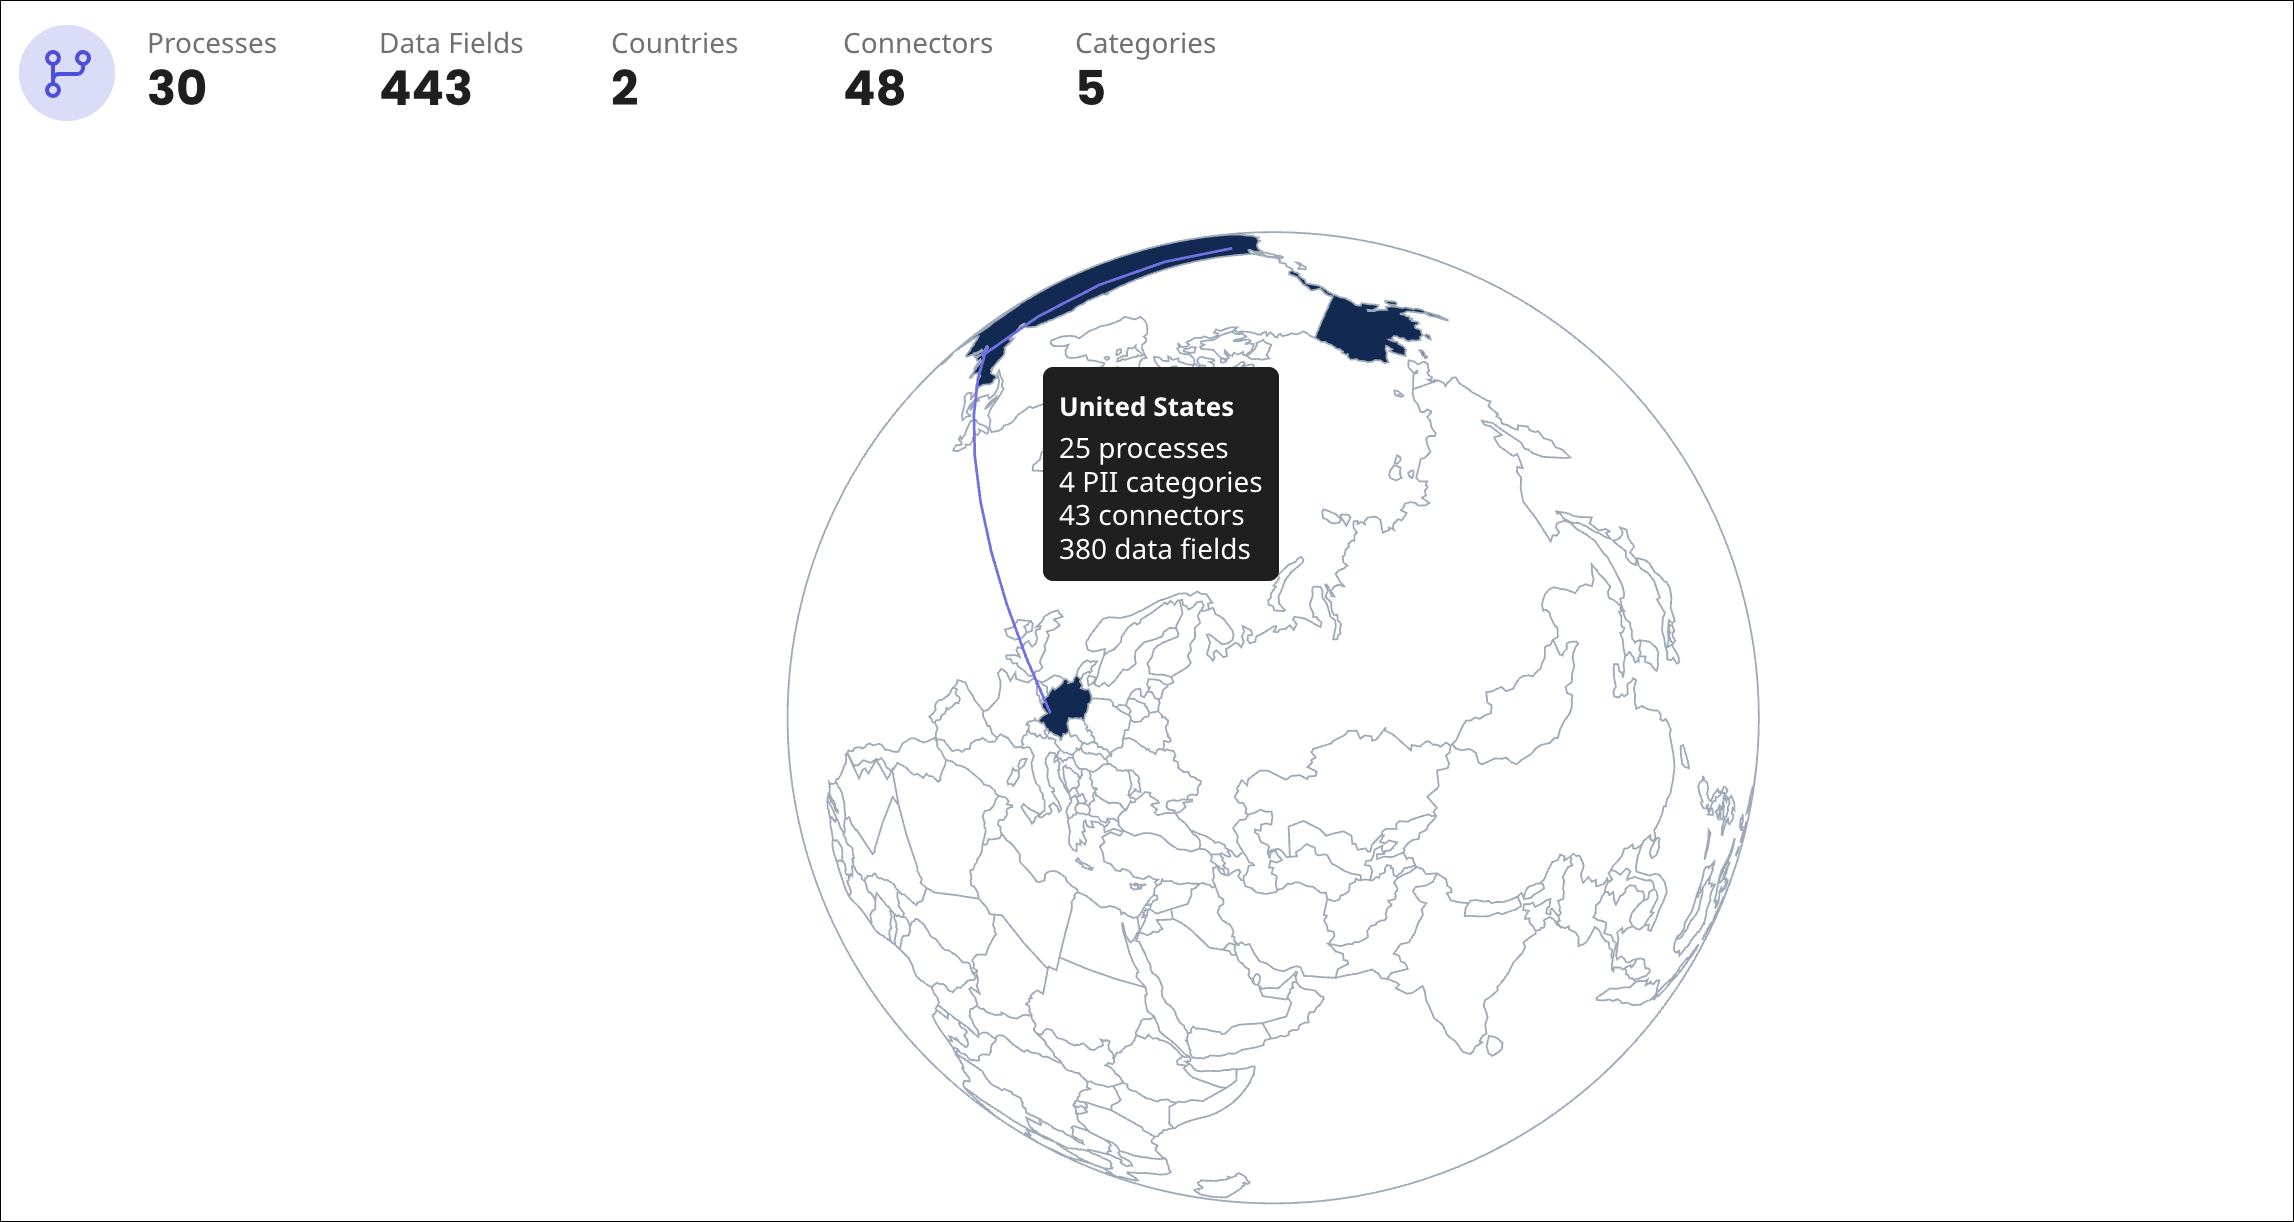
Visualize PII movement
You can view information about the location of PII using the map visualization. Enter fields and select filters to see specific PII information. You can click on the globe to turn it and view other continents. Pause your cursor on a connection near the country to see how many processes, data fields, connectors, and PII categories are associated with the country. Read Visualizing PII statistics for a detailed walkthrough.
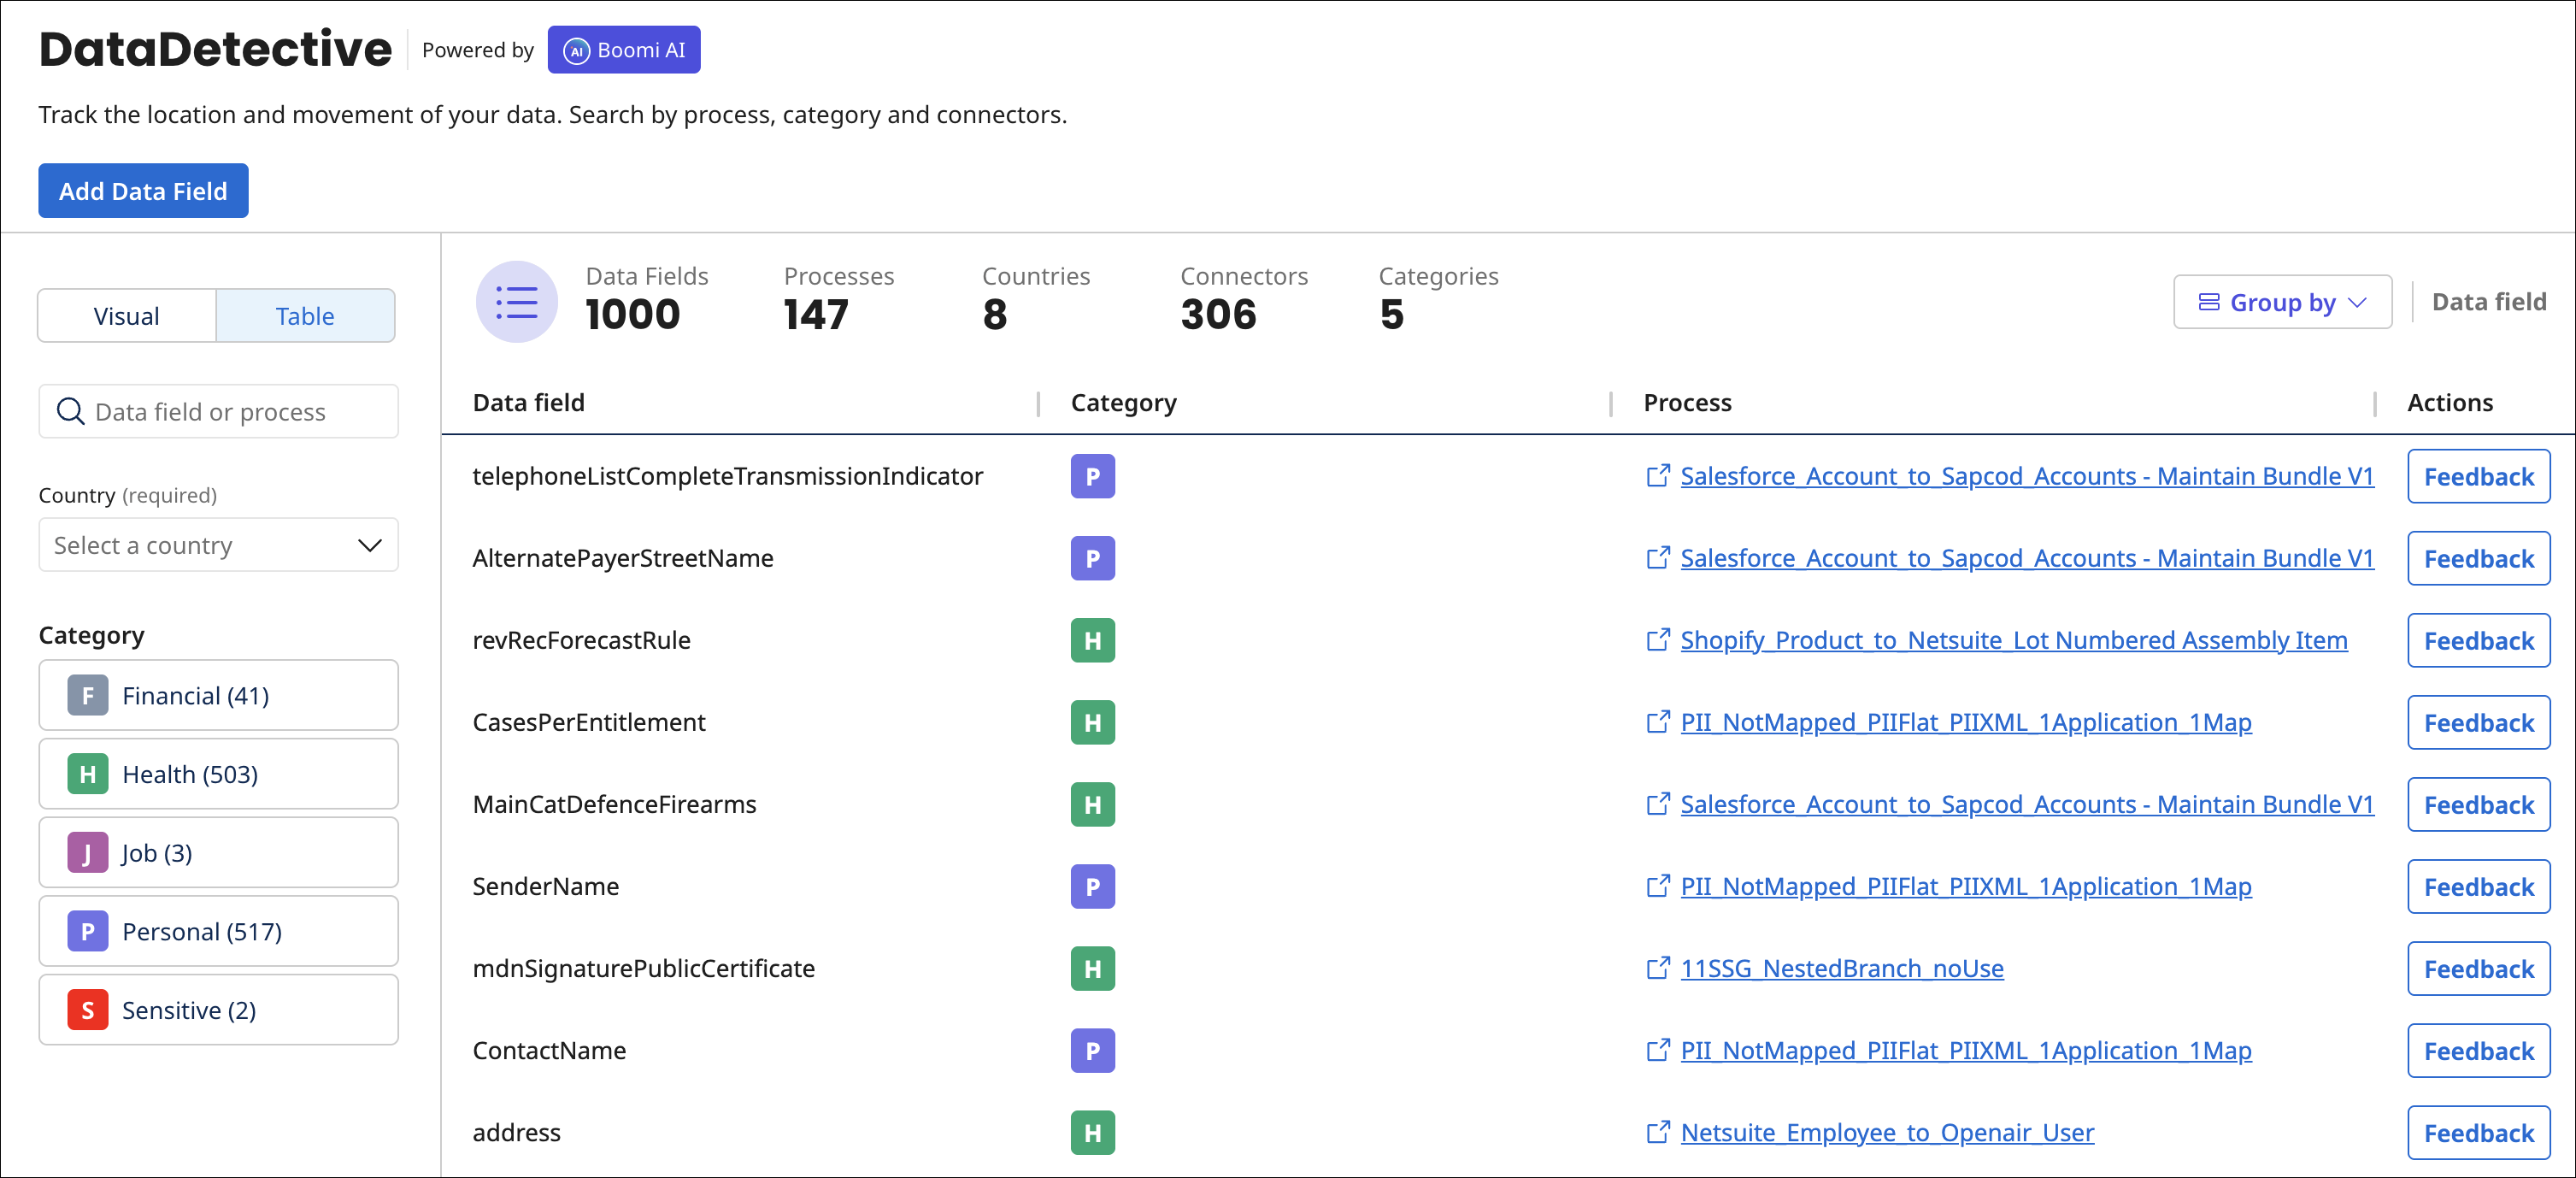
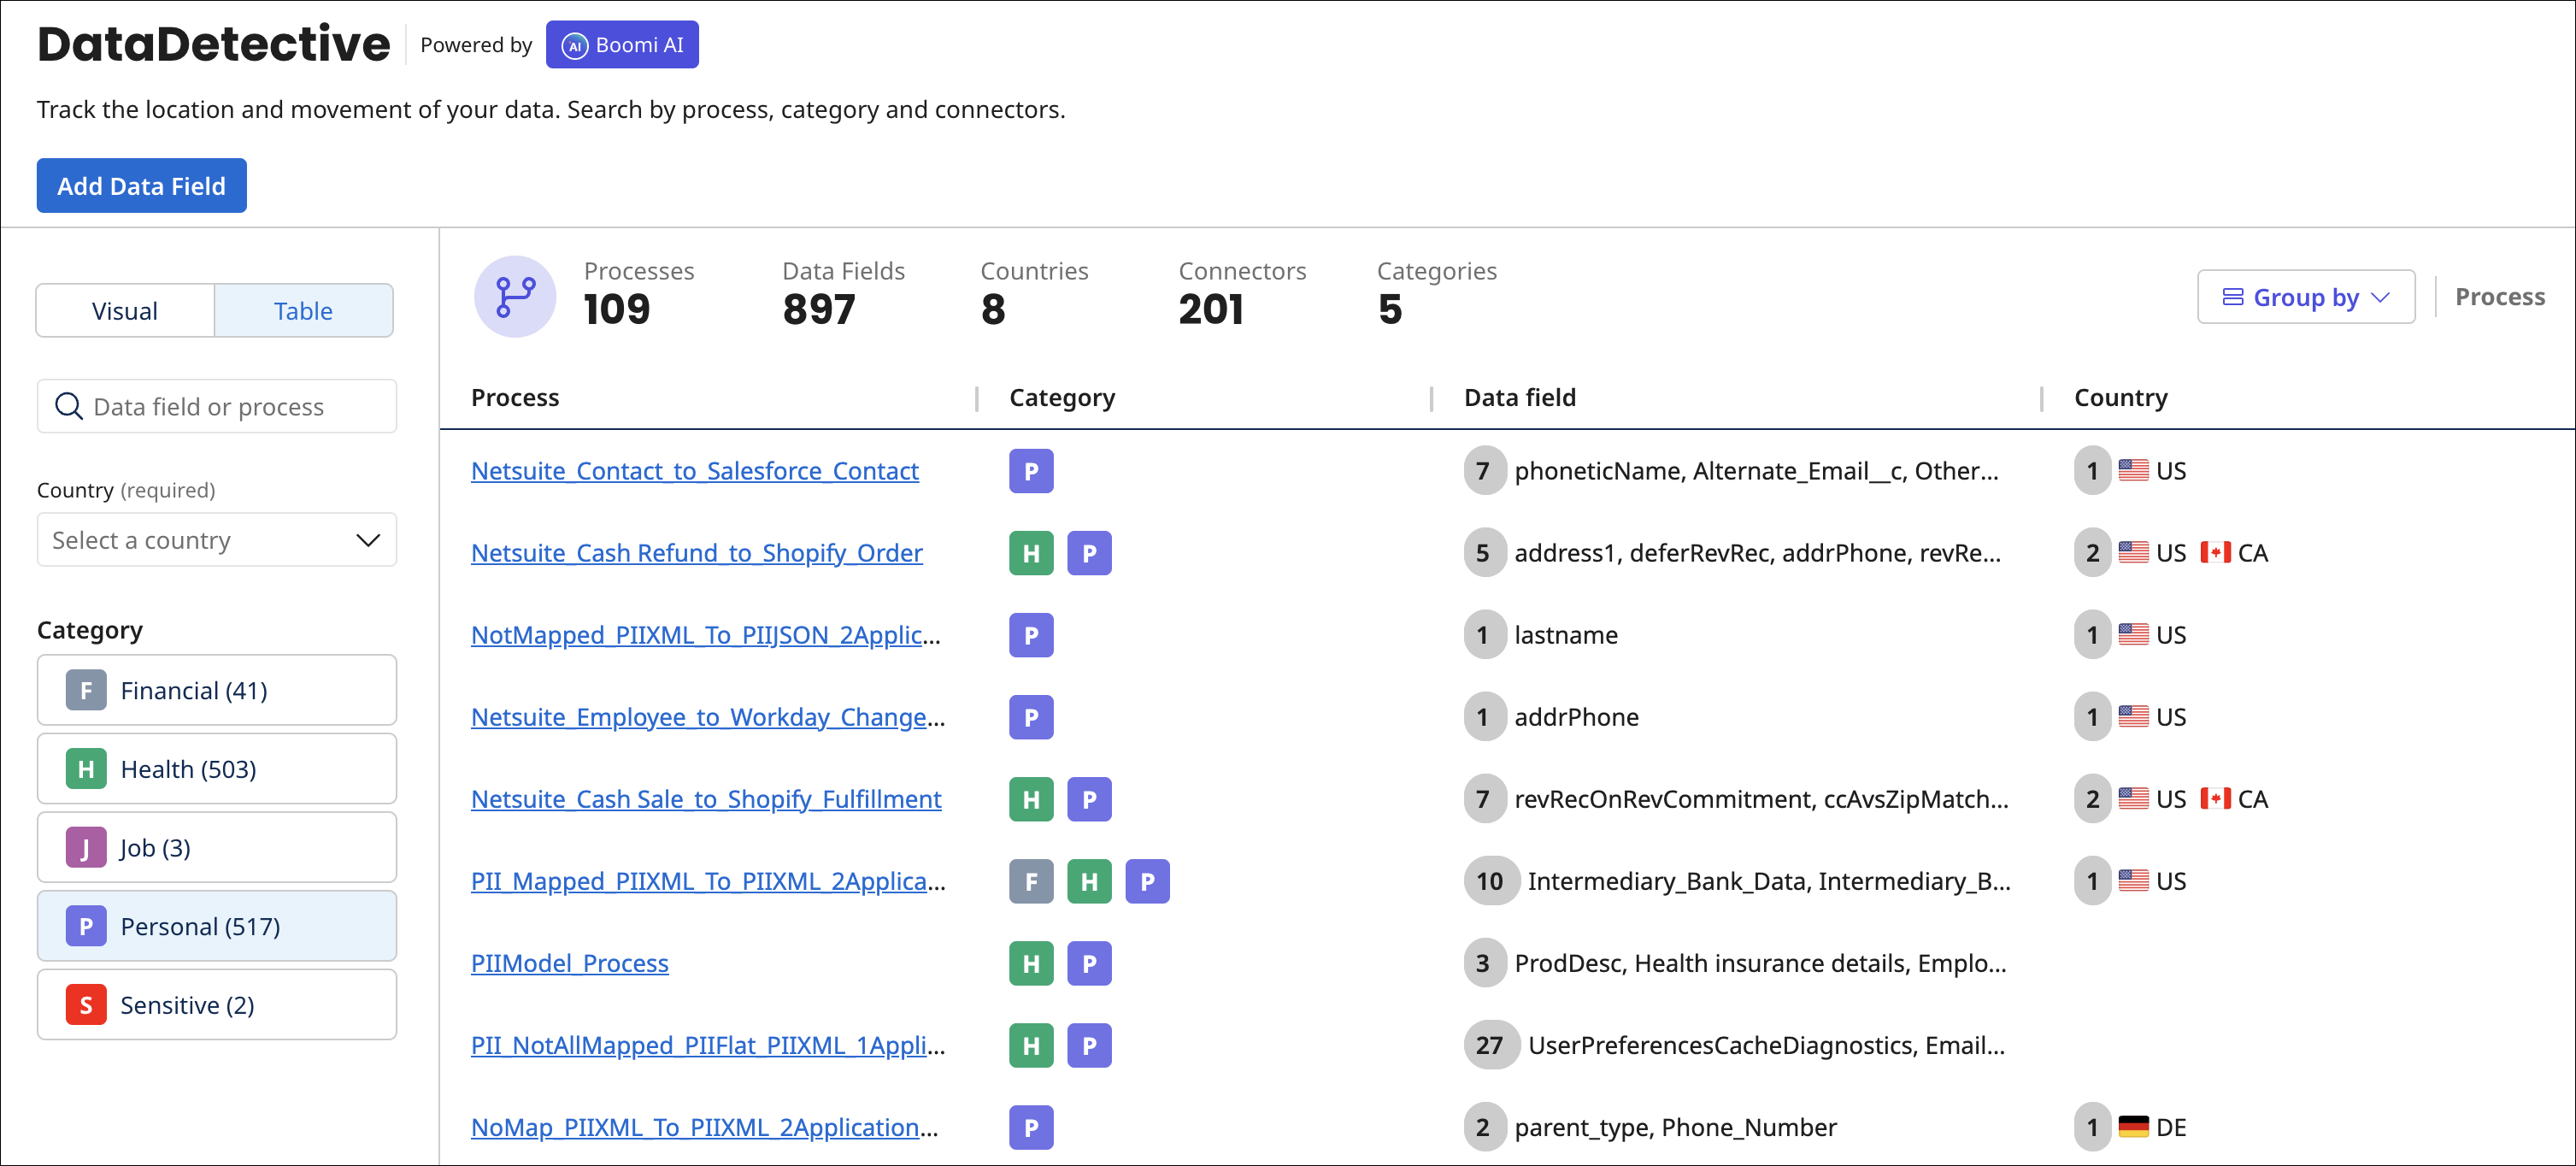
Analyze PII data statistics
You can view statistics in a table to see which process and data fields contain PII. Select filters to see specific PII information. Read Analyzing PII statistics for a detailed walkthrough.
Manage PII data fields
You can suggest tracking new data fields and changes to the categories of existing data fields. Read Managing PII data fields for a detailed walkthrough.